VideoTrails:
Representing & Visualizing Structure
in
Video Sequences
by
Vikrant Kobla
David Doermann
Christos Floutsos
Summarized by Ronnie Maor
Introduction
Information in the form of digital video has become widely available over the last few years. This raises the need for means to index and analyze this form of information automatically, as opposed to methods requiring a human viewer to manually extract the relevant information from the video.
This paper describes a technique which uses the temporal structure of the video - i.e. how the individual frames change over time, as opposed to anylizing each frame by itself. The technique described maps each frame to a single point in a low dimensional space. These points, ordered the same way their frames were in the video, constitute the new representation of the video, called a VideoTrail. The technique presented in this paper was specifically designed to work on video sequences encoded using the popular MPEG compression standard. This approach is more efficient that working on the uncompressed pixel data, because we don't need to pay the overhead of decompressing the video. The technique also relies on interesting features encoded in the MPEG stream, such as the differences between frames that are close to each other in time (when encoding P and B pictures). A pretty easy to read introduction to MPEG can be found at bmrc.berkeley.edu/projects/mpeg/mpeg_overview.html. This introduction contains all the information needed in order to read the article (or this summary). A list of frequently asked questions about MPEG containing more detailed information can be found at bmrc.berkeley.edu/projects/mpeg/faq/MPEG-2-FAQ.html.
Creating the VideoTrail
As mentioned above, generating the VideoTrail representation of a video essentialy consists of mapping each frame to a point in a low dimensional space. This is done in two stages:
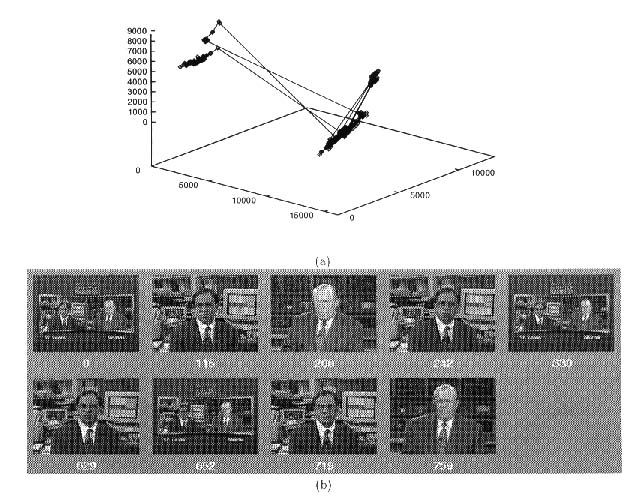
The figure below shows an example of a VideoTrail generated in 3 dimensions. Successive points are connected to show the flow of the video clip. The clip shown is a news interview. It consists of three types of shots - the interviewer, the interviewee, and a medium shot showing both of them.
Analyzing the VideoTrail
The usefullness of the VideoTrail representation is demonstrated by using it to segment the video into different shots, and to detect gradual transitions between them - a non-trivial problem in the compressed domain.
The algorithms presented in this paper were designed to work on points in a 3 dimensional space. An modification of the algorithms for a higher dimensional space can be found in more recent papers.
The analysis consists of three distinct parts:
Results
In order to assess the performance of the technique presented for detecting gradual transitions, the authors ran it on 13 video clips containing a wide variety of content, and many types of gradual transitions such as dissolves, fades, wipes, and other special effect edits. The clips contain about 29,000 frames altogether, and 135 gradual transitions. The results of running the algorithms on the clips were compared to ground truth obtained by manually analyzing the clips.
The results show a recall rate of 90.4% (percent of gradual transitions identified as such), and a precision of 89.1% (percent of segments identified as gradual transitions that were actually such). However, it is hard to judge how good these results are, since the paper doesn't present a comparison with existing techniques for solving the same problem.
Other Applications
The paper demonstrated the usefullness of the VideoTrail representation for detecting gradual transitions between shots. Some other problems for which this representation might be usefull are:
The complete paper, as well as previous papers by the authors referred to in this paper, and more recent work, can be downloaded from Vikrant Kobla's research homepage