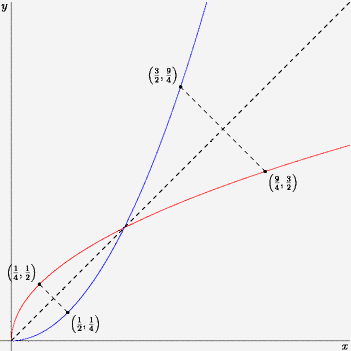
When we graph the inverse function of some function f(x), we see that it is actually the mirror of f along the line x=y. It makes sense! From the definition of inverse functions, we know that for each (a,b) in f(x) there will be a (b,a) in f-1(x). For example, look at the following:

In this example, the blue function is x2 and the red function is the square root of x. We know how x2 looks like - how will we graph its inverse? We will take some points we know on the first graph (for example, the points (0,0), (1/10,1/100), (1/2,1/4), (1,1), (3/2,9/4) and so on), and for each point we will draw a red point which has the opposite coordinates. For example, if we had (1/2,1/4) we will draw a red point in (1/4,1/2). Then we connect all of the red points, and get the wanted red graph!
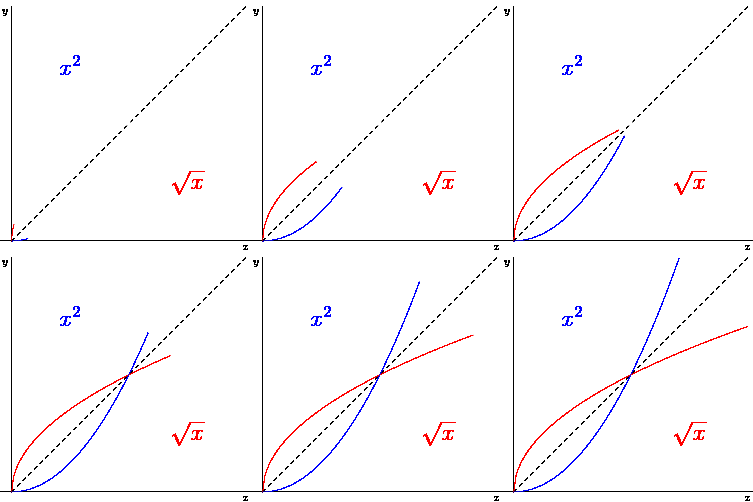
Another option is to think we are the mirror of the original graph, always. This is how it works fast: (try to understand!)

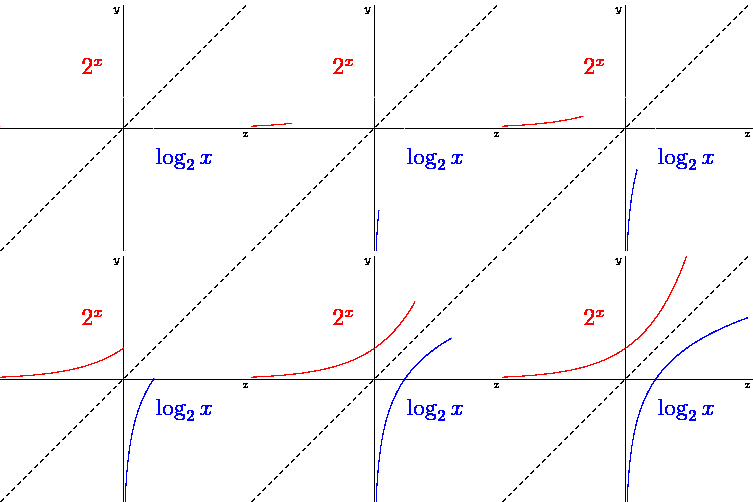
We also know that the logarithm is the inverse function of the exponent. This is how it looks like for 2x and log2x:

In order to practice that, take an invertible function you know (doesn't matter exactly which), and invert it in the following way: